Live Dashboard
Monitor pipeline progress, validation gate verdicts, and costs in real time directly in your terminal
A single NexusArchitect command can spin up dozens of subagents running for tens of minutes in the background. The live dashboard lets you see exactly where things stand without having to ask Claude.
/product:report-statusRun this in your own terminal to launch a screen with a progress tree, detail panel, and action menu.
It re-reads work/pipeline-progress.json every 10 seconds and updates continuously.
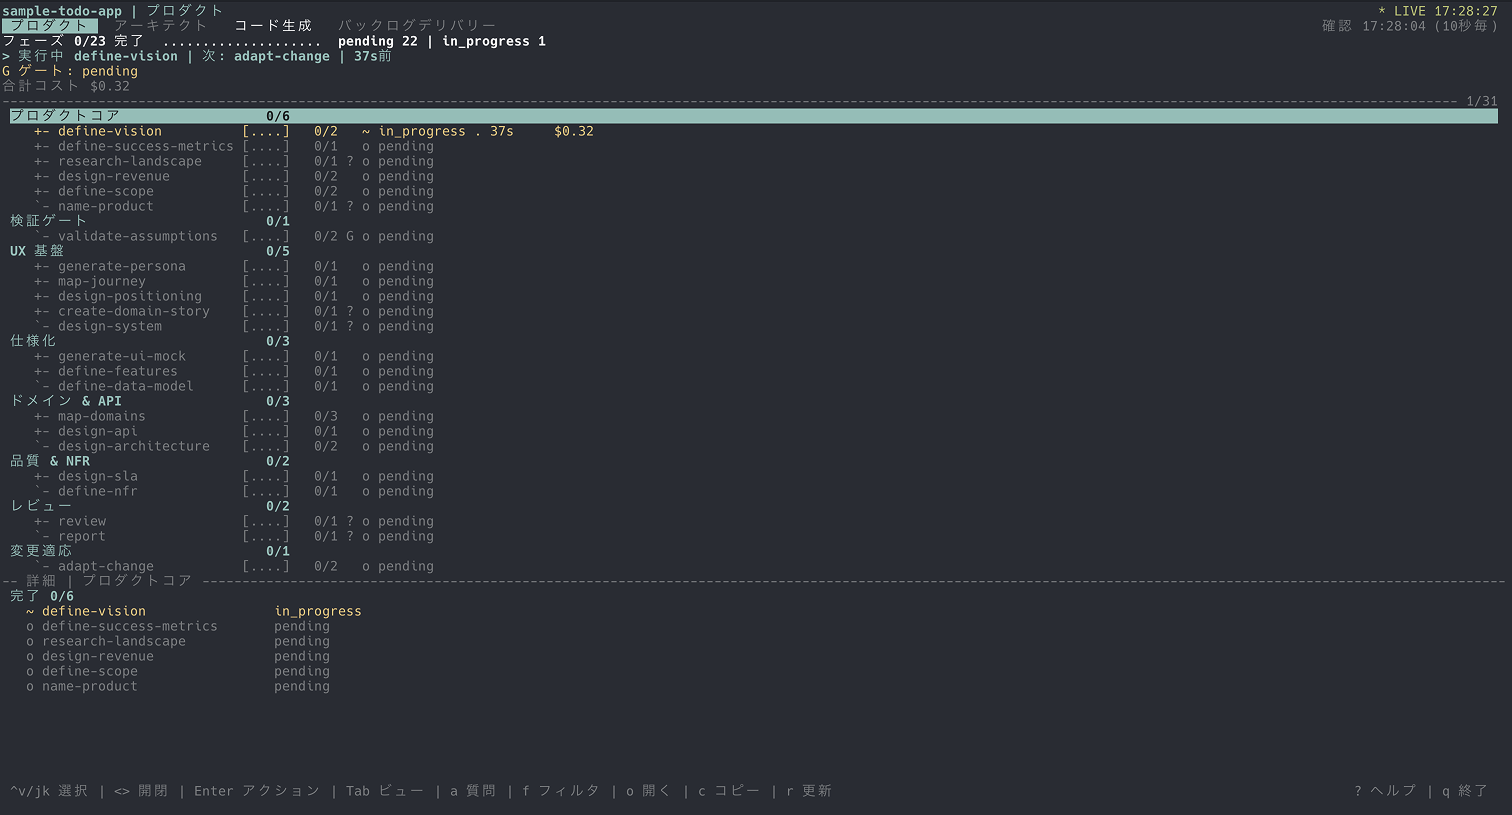
Reading the screen
The header displays a progress bar (Phase 0/23 complete), the currently active phase and the next recommended command (Running define-vision | Next: adapt-change), the validation gate verdict (Gate: pending), and the recorded cumulative cost (Total cost $0.32).
The body is a tree with phases grouped into sections such as “Product Core,” “Validation Gates,” and “UX Foundation.”
Each row shows a completion count (e.g., 0/6) and a status (pending / in_progress / completed, etc.).
Four tabs — one tool
The dashboard is a single tool with four views, switchable with the Tab key.
Tabs for which a project has no data are shown in gray and are automatically skipped during Tab cycling.
| Tab | Invocation command | Contents |
|---|---|---|
| Product | /product:report-status |
Each phase of the product pipeline |
| Architect | /architect:report-status |
Each phase of the architect pipeline (core stages + manually triggered extension stages) |
| Code Generation | (Reachable via Tab from either tab) | generate-scalardb-code / generate-infra-code / generate-docs / generate-frontend — manual generation stages that do not belong to either pipeline |
| Backlog Delivery | /architect:report-backlog-status |
An Epic → Sub-Epic → Issue tree with the implementation/review/merge status of each issue |
The tab separation is a deliberate design decision, not an oversight. The product and architect pipelines are separate pipelines with their own manifests and phase names, so which one is being displayed is always made explicit (previously it was inferred from recorded phase names). Code generation is executed manually after the pipeline has finalized its design decisions, so it does not belong to either pipeline. Dependencies still cross those boundaries, however — for example, generate-scalardb-code is blocked until design-implementation in the Architect tab is complete.
stale (↺) — “complete” has an expiration
Discrepancies in progress are surfaced as-is rather than hidden.
- drift (mismatch between record and files): Displayed when a phase is
completedbut its declared output files do not exist, or when a phase ispendingbut all outputs are already present. The recorded status takes precedence, but the mismatch is visible on screen. - stale (
↺, invalidated completion): Even after a phase reachescompleted, if an upstream phase is later modified, that phase is shown as↺ stalerather than remainingcompleted. The dashboard also indicates which dependency changed and when. Invalidation propagates downstream through the dependency graph, so correcting a single upstream design document causes every phase after it to leave the “complete” state, drop out of then/m donecount, and have re-execution set as the default action. The next recommended command (next:) automatically switches to the earliest affected stage.
Run live mode in your own terminal
Live mode (the default) redraws every 10 seconds and does not exit on its own.
Rather than asking Claude to open this screen, run it yourself in your terminal using !.
!/product:report-statusWhen Claude needs to run this command itself and read the output, pass --once to render a single frame and exit
(without it, the session will hang in live mode).
/product:report-status --onceAdditional options include --json (output state as JSON, intended for CI use), --md (write a Markdown report to a file), --phase=<name> (filter to a specific phase), and --watch=<seconds> (change the refresh interval).
Key bindings
| Key | Action |
|---|---|
↑↓ / j k |
Move selection |
←→ / < > |
Collapse / expand |
Enter |
Open action menu |
Tab / Shift-Tab |
Switch between the four views |
a |
Ask Claude about the selected item |
f |
Filter by status |
o |
Open declared output files |
c |
Copy the next command |
r |
Manually refresh |
q |
Quit |
Related pages
- Pause and Resume — The progress file this dashboard reads and instructions for resuming a run
- Understanding Token Costs — A cost-focused sibling dashboard (
/architect:report-token-cost) that shares the same display conventions - Status Label State Machine — The transition rules (
todo→doing→review→done) shown in the Backlog Delivery tab